
Advanced Kubernetes, Part 3: Requests, Limits and Why Your Pod Got OOMKilled
- Intro
- Two numbers per container
- How a node’s capacity is split up
- CPU: requests share, limits throttle
- Memory: going over the limit gets you killed
- QoS classes: who gets evicted first
- Guardrails for a namespace: LimitRange and ResourceQuota
- Picking the numbers
- A few things that surprise people
- Wrapping up
Intro
In part 2 I said the scheduler decides whether a pod fits on a node by looking at its resource requests, not at what it actually uses. This post is about what that means in practice, and about the other half of the story: what happens once the pod is running and starts using more than it asked for.
Resource settings are the part of a pod spec most people copy from somewhere else and never look at again. That works until a pod gets killed with exit code 137, or an API’s response times double for no obvious reason, or a node falls over and takes half its pods with it. Every one of those can come down to two numbers per container.
Two numbers per container
Every container can set a request and a limit, for CPU and for memory:
containers:
  - name: api
    image: example/api:1.4
    resources:
      requests:
        cpu: 250m
        memory: 256Mi
      limits:
        cpu: "1"
        memory: 512Mi
The request is what the container is guaranteed. The scheduler uses it to decide where the pod fits, and the node holds that much back for it. The limit is a ceiling. The container can use more than its request, up to the limit, as long as the node has room to spare.
What happens at the limit is completely different for CPU and memory, and that difference is behind most of the confusion around this topic. CPU can be slowed down: a container that wants more than its limit just gets less time on the processor. Memory can’t be taken back once it’s in use, so a container that goes past its memory limit is killed.
Units, and a sneaky typo
CPU is measured in cores. 1 is one full core (or one vCPU on a cloud instance), and 250m means 250 millicores, a quarter of a core.
Memory is in bytes, with suffixes. Mi and Gi are powers of 1024, while M and G are powers of 1000, so 512Mi is a little more than 512M. That difference is small. The one to watch out for is a lowercase m, which means milli. memory: 400m is 0.4 bytes. Kubernetes will accept it, and the container won’t start, which is a confusing afternoon if you don’t know to look for it.
How a node’s capacity is split up
A node doesn’t hand all of its memory and CPU to pods. Some is held back for the operating system, some for the kubelet and container runtime, and some as a buffer before the kubelet starts evicting pods. What’s left is called allocatable, and that’s the number the scheduler works with.
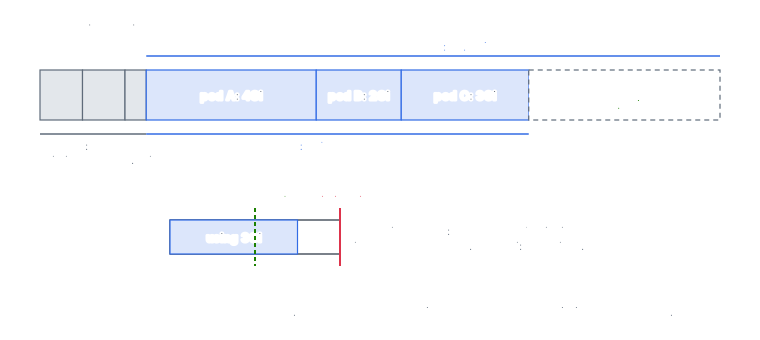
You can see both numbers, and how much has been requested so far, with:
kubectl describe node worker-1
# look for "Capacity", "Allocatable" and "Allocated resources"
The “Allocated resources” section adds up requests and limits for every pod on the node. It’s normal for the limits total to be well over 100%. That’s called overcommitting: you’re betting that not every pod will hit its limit at the same time. Usually that’s a safe bet. When it isn’t, the node runs out of memory and something has to give, which is where QoS classes come in. More on those below.
For what pods are actually using right now, there’s kubectl top, which needs metrics-server installed in the cluster:
kubectl top pods -n shop --containersCPU: requests share, limits throttle
Under the hood, Linux enforces both CPU settings with cgroups, and they do quite different things.
A CPU request turns into a weight. When the node’s CPUs are busy, each container gets processor time in proportion to its request. A container that requested 500m gets twice the share of one that requested 250m. When the node is quiet, the weights don’t matter at all, and any container can use whatever is free. So the request is a guaranteed minimum under contention, not a cap.
A CPU limit turns into a quota per scheduling period, which is 100ms by default. A limit of 500m means the container may use 50ms of CPU time in every 100ms window. Once it’s used that up, it’s paused until the next window starts, even if the node has idle CPUs sitting right there. That pause is called throttling.
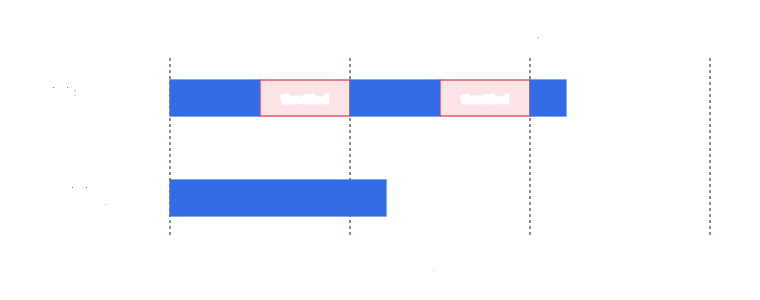
Throttling is sneaky because nothing crashes and nothing gets logged. Your app just gets slower, usually in the worst way: in short bursts, which show up as bad tail latency. It’s also worse than the diagram suggests for multi-threaded apps. The quota is CPU time across all threads, so a service running 8 busy threads can burn through a 50ms quota in about 6ms of real time and then sit frozen for the remaining 94.
You can’t see throttling with kubectl top. The usage it reports looks perfectly fine, often well under the limit, because it’s averaged over time. To see it, look at the container’s cgroup stats, or the container_cpu_cfs_throttled_periods_total metric if you run Prometheus. If that number keeps climbing for a service that cares about latency, its CPU limit is too low.
This is why a lot of teams set CPU requests on everything but leave CPU limits off for latency-sensitive services. The request still protects every container’s fair share when the node is busy, and the service can use spare CPU when there is some. The exception is a multi-tenant cluster where one team’s runaway process mustn’t eat everyone else’s spare capacity. There, limits are a reasonable trade.
Memory: going over the limit gets you killed
Memory is simpler and harsher. The memory request is used for scheduling and for deciding who gets evicted first (more on that soon), but it isn’t enforced while the container runs. The memory limit is. If a container’s memory use goes past its limit, the kernel’s OOM killer ends it on the spot.
You’ll see it in the pod’s status:
$ kubectl describe pod api-6f9b8-zq7rd
...
    Last State:     Terminated
      Reason:       OOMKilled
      Exit Code:    137
    Restart Count:  4
Exit code 137 is 128 plus 9, meaning the process was killed with signal 9 (SIGKILL). There’s no chance to clean up, flush logs or finish requests. The kubelet restarts the container, and if it keeps happening you end up in CrashLoopBackOff.
A few things that make memory limits harder than they look:
- Runtimes don’t always know about the limit. The JVM has been container-aware for years, but by default it only sizes its heap to a quarter of the limit. Set
-XX:MaxRAMPercentageto give it more. Go programs can setGOMEMLIMITso the garbage collector works harder as they get close to the limit, and Node.js has--max-old-space-size. - The heap isn’t the whole story. Threads, buffers, memory-mapped files and the page cache your process dirties can all count, so a process whose heap is well under the limit can still be killed.
- Memory usually doesn’t go down on its own. Many runtimes keep memory they’ve freed rather than giving it back to the OS, so usage creeps up to a plateau. Set the limit with room above that plateau, not above the average.
The usual advice, and I agree with it, is to set the memory limit equal to the memory request. If the container needs 512Mi, request 512Mi and limit it to 512Mi. You avoid overcommitting the one resource that can’t be squeezed, the scheduler’s view of the node matches reality, and a memory leak kills only the leaky container instead of starving its neighbours.
QoS classes: who gets evicted first
There are two different ways a container can die from memory pressure, and it helps to keep them apart. One is the OOM kill above: a single container went past its own limit. The other is eviction: the whole node is running low on memory, so the kubelet picks pods to remove before the node gets into real trouble.
When the kubelet has to choose, it looks at each pod’s quality of service class. Kubernetes works this out for you from the resource settings:
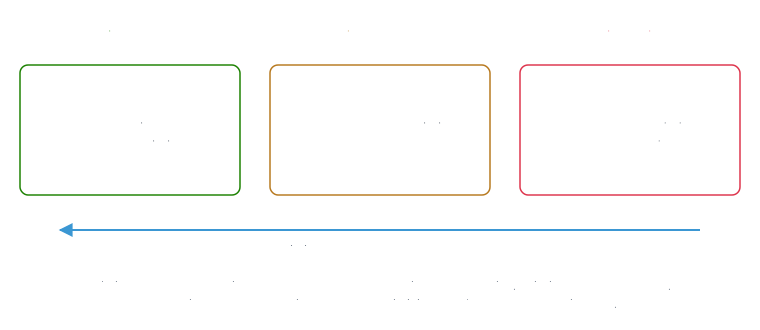
A pod is Guaranteed if every container in it sets both requests and limits for CPU and memory, with each request equal to its limit. It’s BestEffort if no container sets anything at all. Everything in between is Burstable. You can check which class a pod ended up in with:
kubectl get pod api-6f9b8-zq7rd -o jsonpath='{.status.qosClass}'When memory runs short, BestEffort pods go first. They never asked for anything, so they’re always using more than they requested. Burstable pods come next, starting with the ones furthest over their requests. Guaranteed pods are the last to go, because they can’t be using more than they requested. Priority classes from part 2 are part of the ranking too.
Evicted pods show up with a status of Failed and a reason of Evicted, and the message says which resource ran short. Unlike an OOM kill, the pod is gone rather than restarted in place. Its Deployment or other controller creates a replacement, which the scheduler places somewhere else.
So if a pod really matters, make it Guaranteed. And try not to leave anything as BestEffort in a shared cluster. Apart from being first in line for eviction, BestEffort pods have no request, so the scheduler thinks they need nothing and will happily pack them onto a node that’s already full.
Guardrails for a namespace: LimitRange and ResourceQuota
Relying on everyone to set sensible resources by hand doesn’t scale. Two objects help.
A LimitRange sets defaults and bounds for containers in a namespace. Any container created without resources gets the defaults filled in, and anything outside the min and max is rejected:
apiVersion: v1
kind: LimitRange
metadata:
  name: container-defaults
  namespace: shop
spec:
  limits:
    - type: Container
      defaultRequest:   # used when a container sets no request
        cpu: 100m
        memory: 128Mi
      default:          # used when a container sets no limit
        memory: 256Mi
      max:
        memory: 2Gi
A ResourceQuota caps the total for the whole namespace, so one team can’t request the entire cluster:
apiVersion: v1
kind: ResourceQuota
metadata:
  name: shop-quota
  namespace: shop
spec:
  hard:
    requests.cpu: "8"
    requests.memory: 16Gi
    limits.memory: 24Gi
    pods: "50"
One side effect to know about: once a quota covers CPU or memory, every new pod in that namespace must declare those resources, or it’s rejected. That’s why the two usually go together. The LimitRange fills in defaults so pods that forget their resources still pass the quota.
Picking the numbers
None of this helps if the numbers themselves are guesses. Here’s how I’d approach it:
- Run the workload with generous limits and watch it under realistic load for a while, using
kubectl topor, better, your metrics system over a few days. - Set the memory request and limit to the peak you saw, plus some headroom (20-30% is a common starting point).
- Set the CPU request to roughly the typical usage under load, not the peak. Decide whether you want a CPU limit at all, based on the throttling section above.
- Revisit after big changes. A new feature or a library upgrade can shift memory use a lot.
The Vertical Pod Autoscaler can do the watching for you and suggest values (or apply them). It’s covered in the autoscaling part of this series. Newer Kubernetes versions can also resize a running pod’s CPU and memory in place, without restarting it, which takes some of the pain out of getting it wrong the first time.
A few things that surprise people
- Requests are per container, but a pod’s total is what gets scheduled. Sidecars count. Init containers are a special case: since they run one at a time before the app starts, the pod needs the larger of the biggest init container or the sum of the app containers, not both added up.
- A pod with containers that only set limits isn’t BestEffort. If you set a limit and no request, Kubernetes copies the limit into the request.
- Throttling can happen at low average usage. A service that averages 20% of its CPU limit can still be throttled heavily if its work arrives in bursts.
- Memory pressure evictions and OOM kills both say “memory”, but the fix is different. OOMKilled means that container’s limit is too low or it has a leak. Evicted means the node was overcommitted, and the fix is usually better requests across the board.
Wrapping up
Requests decide where a pod lands and what it’s guaranteed. Limits decide what happens when it wants more: CPU gets slowed down, memory gets the container killed. Most of the strange behaviour people blame on Kubernetes, the latency spikes, the 137s, the pods vanishing during a busy hour, comes from one of those two numbers being set without much thought.
Next in the series: autoscaling, from the Horizontal Pod Autoscaler to KEDA and adding nodes automatically.
Thanks for reading! If you have questions or spot a mistake, find me on twitter.